Statistics: Interpreting Displays & Running a Data Investigation
1
/ 1
Reading & Investigating Data
Year 6 Mathematics
· Statistics ·
WA6MPSS1–SS3
Compare groups, then describe and question the data.
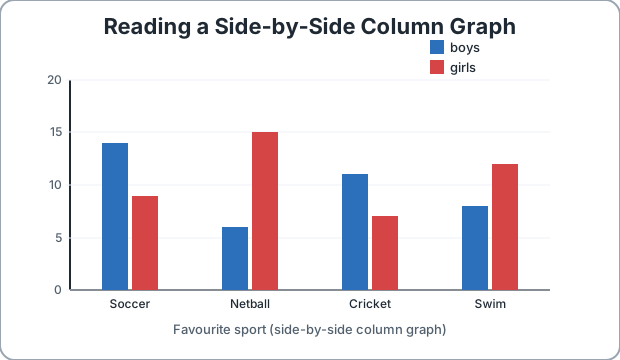 Compare groups, then describe and question the data.